The oceans contain the largest untapped source of renewable energy (RE) and have fast become the new arena for RE technology deployment through the development of large-scale offshore wind farms. However, offshore wind is just the beginning.
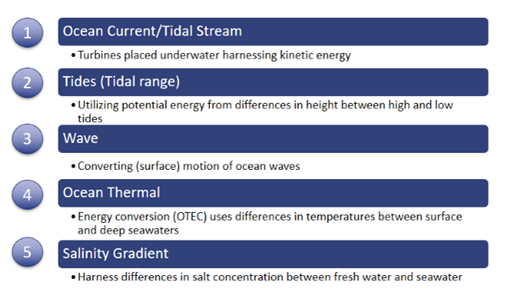
Ocean Renewable Energy (ORE) technologies are defined as technologies harnessing the energy potential of ocean waves, tides, currents, and temperature and salinity gradients1. Despite the massive potential, ORE represent an insignificant share of the renewable energy market today. Installations in 2021 amounted to only around 2.8 MW, bringing the total historical installed capacity to an estimated 558 MW at year’s end. In comparison the total RE capacity installed globally was 2,800,000 MW at the end of 2020 – ORE represent a meagre 0.02 % globally. To make things worse, roughly 88 % of the ORE installed capacity are represented by two huge tidal range projects: the 240 MW Rance Tidal Power Station in France (1966) and the 254 MW Sihwa Lake Tidal Power Station in South Korea (2011) and when looking at wave and tidal stream only a fraction of capacity is still in operation as installations were mainly driven by pilot projects.
Since tidal range projects are characterised by significant impact for ecosystems, the technology has recently fallen out of favour. Being more mature than OTEC and salinity gradient technologies, tidal stream and wave power are expected to become the new rising stars of ORE or RE in general2. This blog will focus on wave power, but most of the points are valid for broader ORE technologies.
Why wave power?
The obvious reason first: transforming the forces of waves to electricity (or sometimes freshwater) does not emit CO2 whereas the theoretical potential is massive. In many locations wave power is complementary to annual output profiles of wind and solar. While generally being less predictable than other RE technologies, electricity output of wave power rarely drops to zero as does PV during the night or wind power in periods that lack wind entirely. Wave power comes with little impact on the environment and offers great solutions for off-grid applications for island states to replace diesel. Lastly, electricity production on land often competes with other forms of land-use like agriculture, housing or forests. Coastal areas offer sufficient space for deployment of utility-scale arrays with little to no impact on fishing or shipping.
What concepts do exist today?
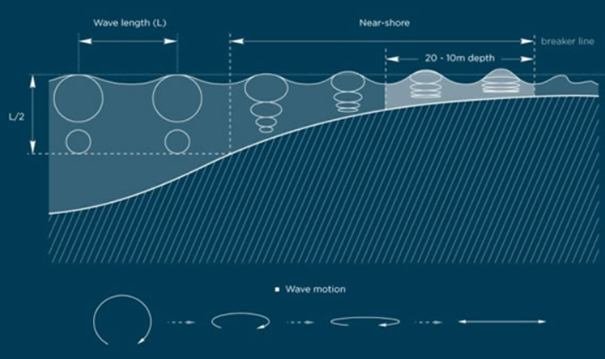
To better understand the existing wave energy converter (WEC) concepts, one must take a closer look at the physics behind wave motion. Waves emerge as a result of the wind blowing over the sea. The changes in pressure let water columns oscillate in a circular motion. Depending on the water depth the movement of waves is best characterised either by an up-and-down or back-and-forth (see figure 2). As a result, wave power can be classified in three different designs: offshore, near-shore and dry setup. Furthermore, a distinction in submerged or surface designs is common. So far, no dominant design has been adopted. However, point absorber designs3 offer promising solutions for stand-alone offshore application or co-location with offshore wind farms where existing grid infrastructure can be leveraged.
Why has large scale adoption not yet taken place?
Although the future looks very promising, most wave power designs are either in full-on R&D, pilot or demonstration phase and LCOE5 are comparably high. The oceans represent a harsh environment for any kind of equipment, which results in the need to use very durable and expensive materials. Operation and maintenance at sea is costly and time consuming as it involves vessels, divers and cranes depending on the setup. The generated electricity must be transferred on land using subsea cables and then needs to be connected to the main grid which results in transmission losses and additional costs for grid infrastructure. Outside of a few European countries there is insufficient financial incentive and no government issued revenue support schemes that would push developers to focus on pipeline building. Additionally, with a lack of long-term operational data and commercial viability lenders are unwilling to finance multi-million-dollar equipment investments.
Wave power outlook
ORE attracted public and private funding totalling €70 million in 2021. This represents a 50 % increase compared to 2020 and shows the growing appeal of ORE. Deals struck between component manufacturers and industrial partners add to that perception, e.g. Swedish Minesto and Schneider Electric or French Sabella and General Electric. For 2022 sustained growth is expected. Up to 2.8 MW of wave energy capacity is lined up for deployment, the bulk of which will come from full-scale devices. Most of these deployments will occur in the UK, Spain and Portugal. Four new full-
scale devices – made by Corpower Ocean, Eni SpA, Bombora and Wavepiston – should hit European
waters in 2022. Outside Europe, installations could add 1.1 MW of wave energy capacity to the global total. Several devices are expected to be deployed: in the USA, Oscilla Power’s Triton C and in China, GIEC’s second full-scale device6. While the underlying macro-economic conditions have introduced new challenges such as inflation, shipping costs, supply chain disruptions and scarce resources, investors seem to remain confident that ORE represent the next big opportunity in renewable energy.
Footnotes
1 Besides ORE technologies Marine Renewable Energy (MRE) also includes offshore wind, marine biomass (algae) or floating solar PV.
2 https://www.oceanenergy-europe.eu/wp-content/uploads/2022/03/OEE_Stats_2021_web.pdf
3 Point absorbers convert energy through the relative motion between a buoy and a submerged, fixed structure
4 http://aw-energy.com/waveroller/#surge
5 Levelised cost of electricity
6 https://www.oceanenergy-europe.eu/wp-content/uploads/2022/03/OEE_Stats_2021_web.pdf